

In today’s increasingly connected world, network issues can significantly impact business operations, online experiences, and even personal productivity. Whether it’s slow website access, intermittent connectivity, or high latency affecting video calls, understanding the root cause of network problems is crucial. One indispensable tool in the network engineer’s toolkit is traceroute.
Traceroute is a diagnostic utility designed to track the path that data packets take from your computer to a destination server, highlighting each network hop along the way. By revealing potential bottlenecks and latency issues, traceroute allows users to identify where network problems occur and take corrective measures. This article provides an in-depth explanation of traceroute, its underlying mechanisms, practical applications, advanced techniques, and best practices for troubleshooting networks effectively.
Understanding Traceroute
Traceroute, sometimes referred to as tracert on Windows systems, is more than just a command-line utility. It is a method for visualizing the path data packets traverse through a network, offering insight into the behavior of routers and other networking devices along the route.
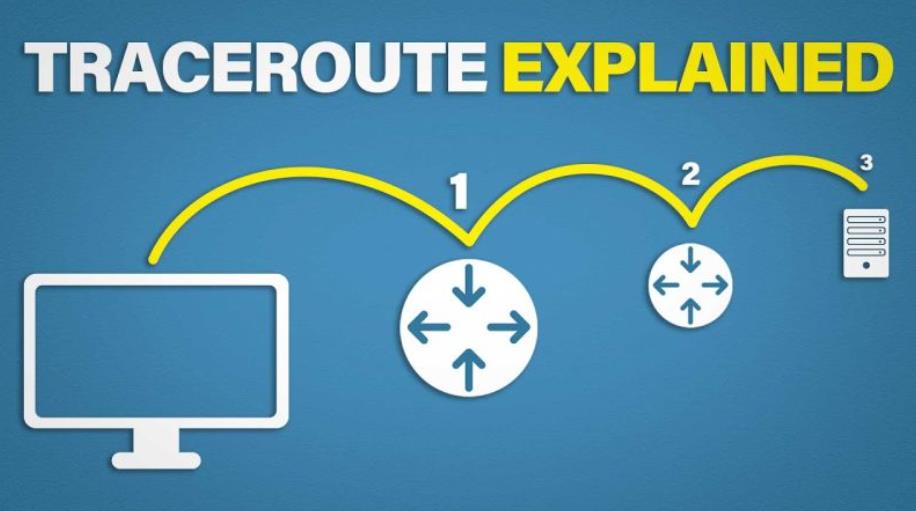
At its core, traceroute works by sending packets with gradually increasing Time-to-Live (TTL) values. TTL represents the number of hops a packet can travel before being discarded by a router. When a packet reaches a router, its TTL decreases by one. If TTL reaches zero, the router discards the packet and sends an ICMP “Time Exceeded” message back to the source. By incrementing TTL sequentially, traceroute maps each hop from source to destination, providing valuable information about the route taken and the latency at each step.
While traceroute primarily uses ICMP (Internet Control Message Protocol) packets on Windows, Unix-based systems often use UDP (User Datagram Protocol) packets by default. This distinction can affect the results depending on network firewall rules, as some routers may block ICMP traffic while allowing UDP packets.
Traceroute is commonly used alongside ping, another diagnostic tool. Ping measures the round-trip time of packets to a destination, giving a quick indication of latency and packet loss. Traceroute expands on this by showing each hop in the path, helping to pinpoint where delays or drops occur.
Using Traceroute Across Platforms
Traceroute is available on nearly every operating system, though the command syntax differs slightly:
- Windows: Use
tracert <hostname or IP>. For example:tracert google.com - Linux/macOS: Use
traceroute <hostname or IP>. For example:traceroute google.com
Key options often include setting a maximum hop count (to prevent indefinite looping), adjusting timeout values, or specifying the protocol (ICMP, UDP, or TCP). Learning to use these parameters can help tailor traceroute for different troubleshooting scenarios.
Practical Applications of Traceroute
Traceroute shines in real-world network troubleshooting. Its ability to reveal each hop and measure latency enables users to diagnose a wide range of network issues.
Identifying High Latency
One of the most common uses of traceroute is pinpointing latency problems. By examining the response time at each hop, you can determine where delays occur. For instance, if the first few hops show minimal latency but a specific hop midway through the path shows a significant spike, it indicates a potential bottleneck at that router or the ISP network segment.
Detecting Packet Loss
Packet loss can lead to slow connections, dropped calls, and poor application performance. Traceroute helps identify where packets are being lost. If certain hops fail to respond consistently or show high loss rates while others function normally, the problem may reside with the specific router, link, or network segment.
Diagnosing Network Bottlenecks
Traceroute also aids in isolating network bottlenecks. By tracing a path to a distant server, you may discover that delays are not caused by your local network but by upstream ISP routing issues or congested international links. Understanding where the problem lies allows you to take appropriate action, such as contacting the ISP, rerouting traffic, or adjusting network configurations.
Real-World Example
Consider a scenario where a company in New York experiences slow access to a web server hosted in California. Running a traceroute might yield the following observations:
- Hops within the local network: 1–5 ms
- ISP core network: 20–30 ms
- Intercity backbone: 80–100 ms
- Last hop to server: 250–300 ms
In this example, the latency jump occurs at the intercity backbone, suggesting the bottleneck lies within the ISP’s long-distance links rather than the local office network. This insight allows IT teams to escalate the issue effectively.
Advanced Traceroute Techniques
For professionals and network enthusiasts, basic traceroute functionality can be expanded with advanced techniques and complementary tools.
Protocol Selection
Traceroute can be run using different protocols:
- ICMP: Common for Windows; sometimes blocked by firewalls.
- UDP: Default on many Unix systems; can bypass certain restrictions.
- TCP: Useful for tracing routes to servers that block ICMP/UDP traffic, often applied to specific ports like HTTP (80) or HTTPS (443).
Selecting the right protocol can ensure accurate results in environments with restrictive firewalls.
Parameter Optimization
Tweaking traceroute parameters enhances its diagnostic capabilities:
- Maximum hops (
-m): Limits the number of hops to prevent excessive traces. - Timeout (
-w): Adjusts how long traceroute waits for a response. - Packet size: Changing packet size can reveal issues with MTU (Maximum Transmission Unit) mismatches.
Complementary Tools
Traceroute is often used alongside other tools for more comprehensive analysis:
- MTR (My Traceroute): Combines traceroute and ping to provide real-time statistics on packet loss and latency.
- Pathping (Windows): Offers a detailed view of network paths with loss and latency over time.
- Wireshark: Captures and inspects packets for deeper analysis.
These tools, combined with traceroute, provide a robust framework for network troubleshooting.
Automated Monitoring
For ongoing network performance tracking, traceroute can be automated via scripts. Scheduled traces to critical servers can identify intermittent issues, detect routing changes, and alert IT teams to potential problems. Automation is particularly valuable in large enterprise networks, cloud environments, and global operations.
Visualization
Network topology visualization enhances the readability of traceroute results. Many online tools and platforms allow you to generate maps showing the geographic path of packets, hop locations, and latency metrics. Visual representation simplifies interpretation, especially for non-technical stakeholders.
Common Misconceptions and Limitations
While traceroute is a powerful tool, understanding its limitations is essential.
- Firewall and NAT Considerations: Some routers, especially behind firewalls or NAT devices, may not respond to traceroute requests, resulting in missing hops.
- High Latency ≠ Faulty Network: Temporary spikes in latency can occur due to transient congestion and do not always indicate a persistent issue.
- Cross-Border Variability: International routes often have higher latency due to distance, multiple transit providers, and variable routing policies.
- Asymmetrical Routes: The return path of packets may differ from the forward path, causing anomalies in response times.
Being aware of these nuances helps avoid misinterpretation of traceroute results.
Best Practices for Network Troubleshooting with Traceroute
Traceroute becomes more effective when used systematically. Consider the following best practices:
- Start Local, Then Expand: Begin by tracing routes to local servers, then progressively to distant or external servers to identify where issues begin.
- Combine Tools: Use traceroute in conjunction with ping, MTR, and monitoring solutions for comprehensive analysis.
- Document Results: Keep logs of traceroute outputs for comparison over time, helping to detect intermittent or recurring problems.
- Use Visual Aids: Map routes visually to highlight bottlenecks and simplify communication with team members or ISPs.
- Automate Monitoring: Scheduled traceroutes and alerts can proactively identify issues before they impact operations.
Following these practices ensures traceroute is not just a one-time diagnostic tool but an integral part of your network management strategy.
Practical Tips for Traceroute in Different Environments
Windows
- Use
tracertwith/dto skip DNS resolution and speed up results:tracert /d google.com - Run as administrator for complete network visibility.
Linux/macOS
- Use
traceroute -Ifor ICMP ortraceroute -T -p 443for TCP over HTTPS. - Combine with
mtrfor continuous monitoring:mtr google.com
Corporate Networks
- Be mindful of security policies; some corporate networks block ICMP or UDP packets.
- Coordinate with IT teams to ensure traceroute traffic is allowed.
Cloud and Remote Servers
- Use traceroute to detect latency issues between different cloud regions or data centers.
- Identify ISP-specific routing inefficiencies or cross-continental bottlenecks.
Traceroute is an essential tool for anyone who needs to understand and troubleshoot network performance. By revealing each hop along a packet’s journey and highlighting latency and packet loss, traceroute empowers IT professionals to diagnose problems efficiently and communicate findings clearly.
While the tool has limitations—such as firewall interference or asymmetrical routes—its value in pinpointing bottlenecks, monitoring network health, and providing actionable insights is unmatched. Combining traceroute with advanced tools like MTR, Pathping, and visualization platforms elevates network troubleshooting from guesswork to a systematic, data-driven process.
Whether you are a network engineer, IT support professional, or a technically curious user, mastering traceroute equips you with the knowledge to tackle connectivity challenges confidently, optimize network performance, and maintain reliable digital experiences.
By incorporating traceroute into your troubleshooting workflow, documenting results, and visualizing network paths, you can proactively manage network issues, ensuring smoother operations and improved connectivity for all users.